Enrich your knowledge with our informative blogs
What does range mean in math?

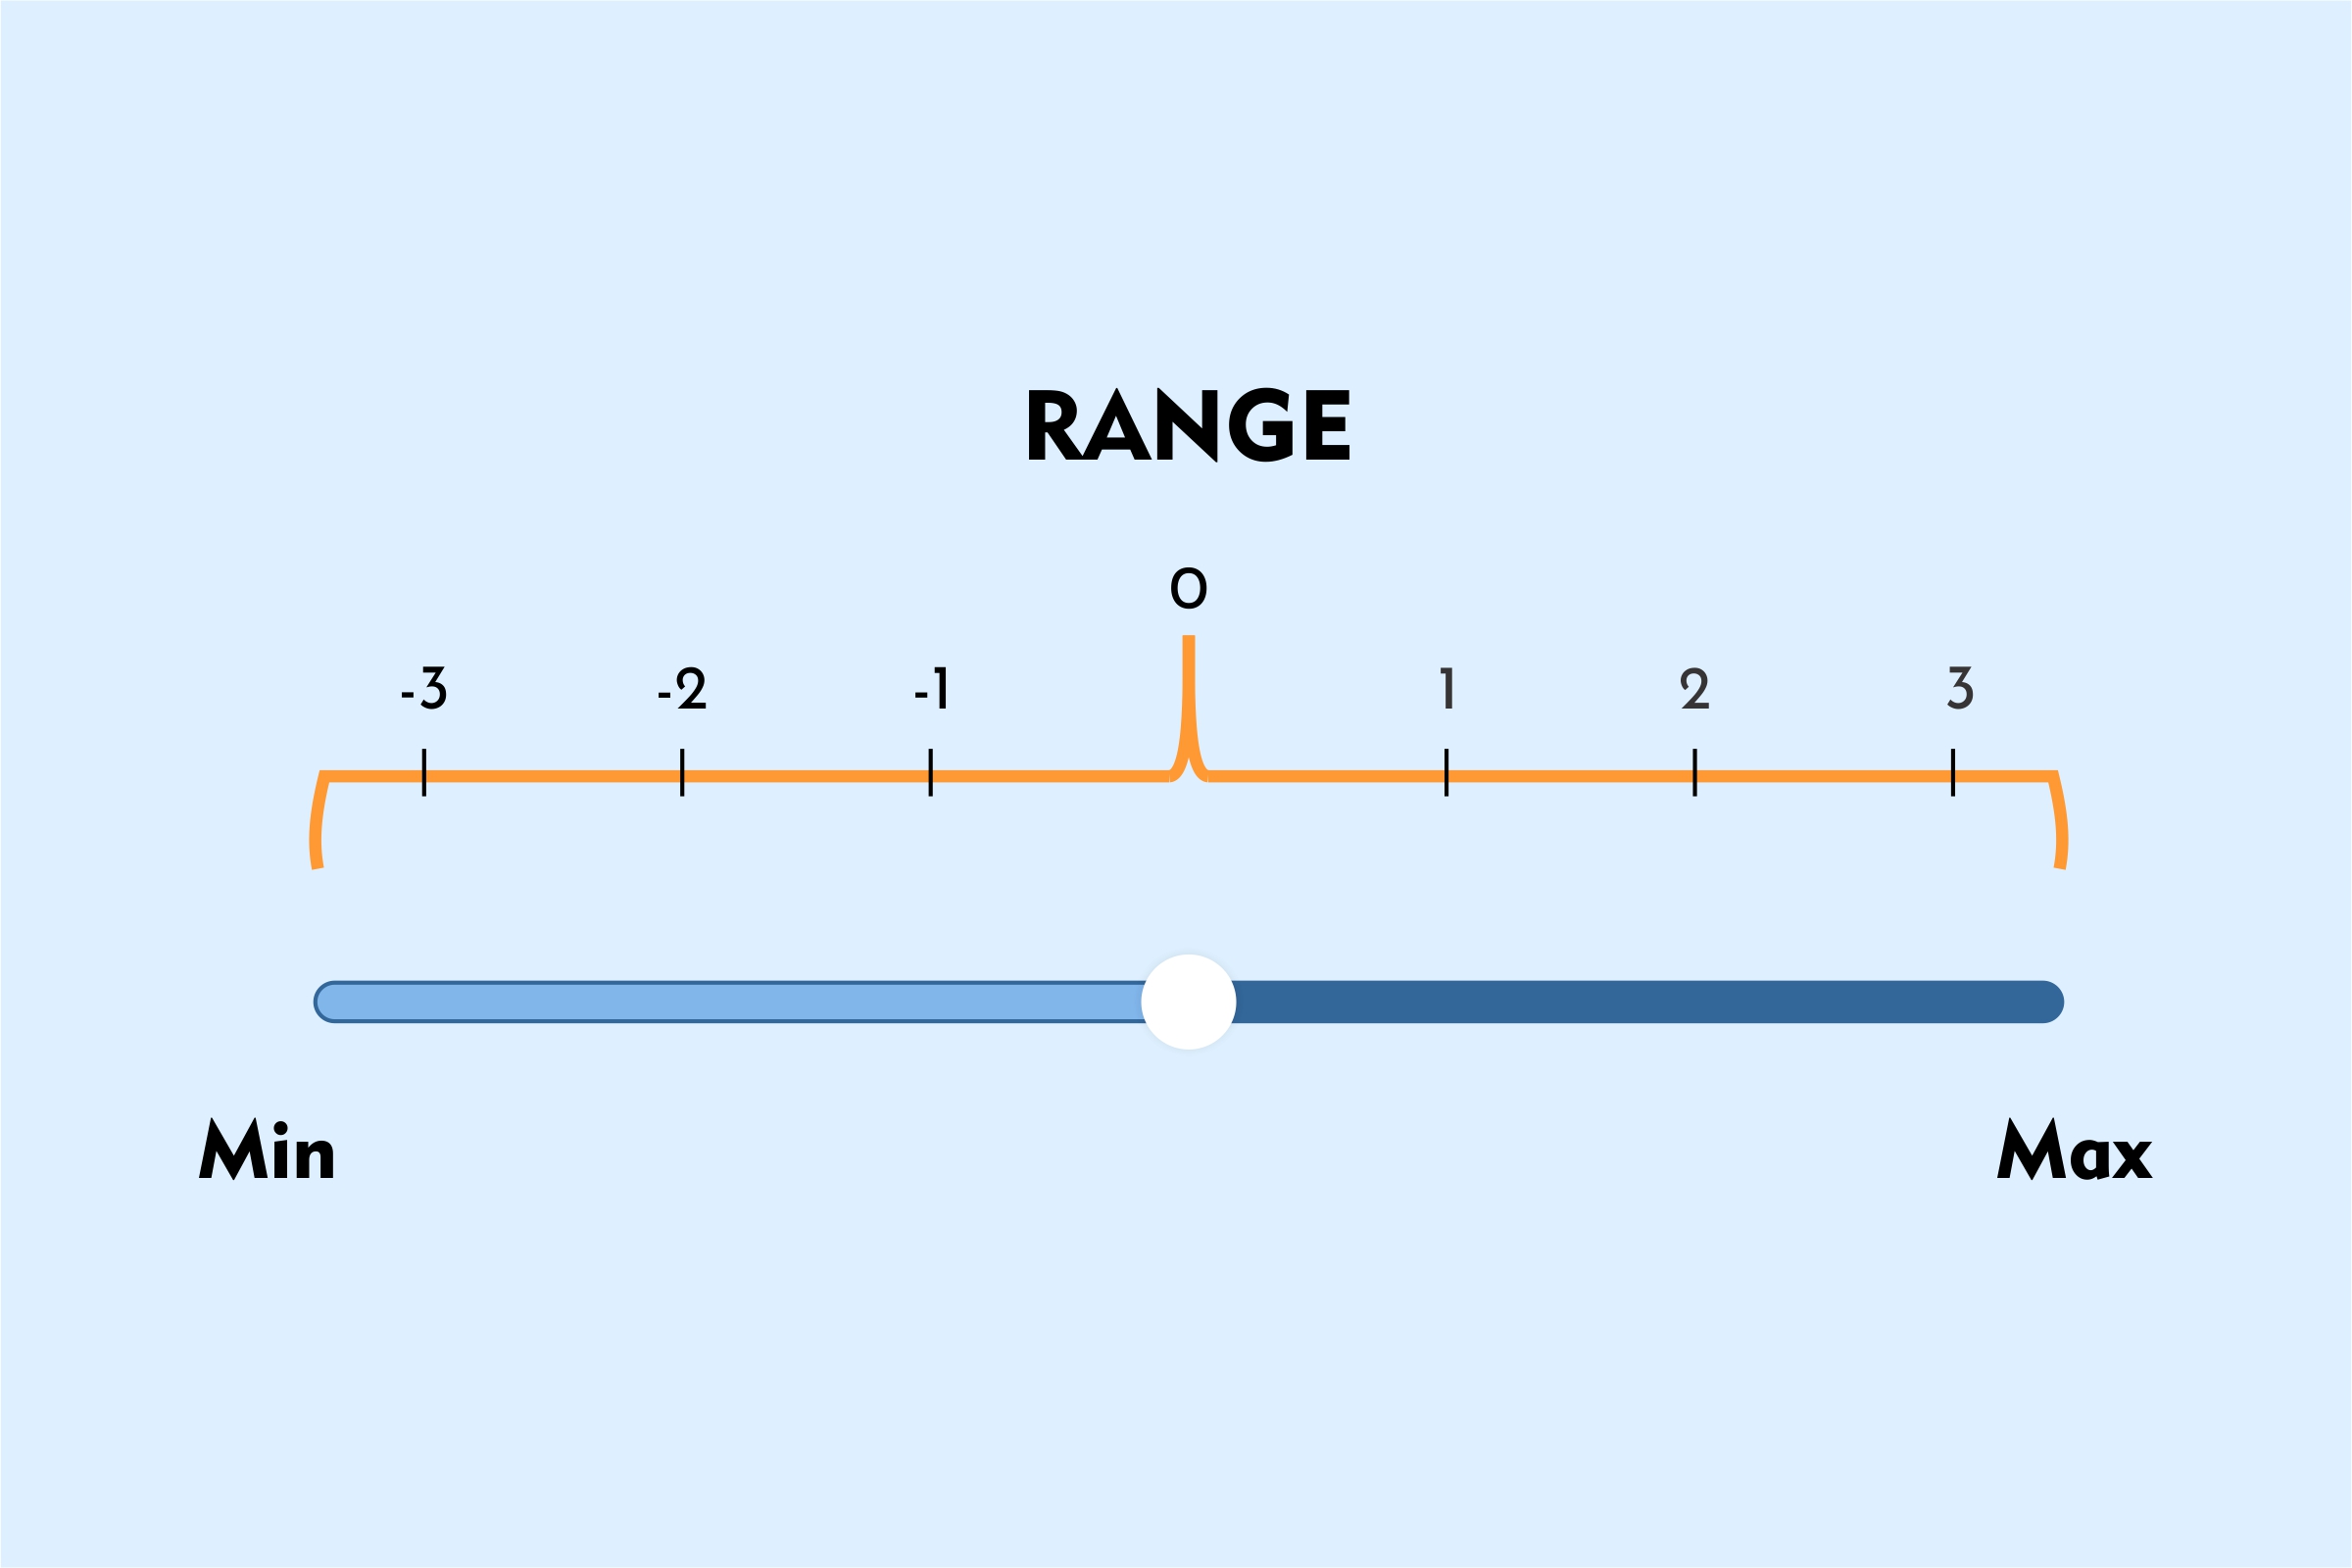
Range: Given a set of numbers, range is defined as the difference between the highest value and the lowest value. It is one of the methods used to find the central tendency in statistics. Some other similar methods are mean, median and mode that help us to give information and draw conclusions about a given data set.
Range helps us to understand the span or spread of data. Also, it helps to identify the gap between the largest and the smallest number.
How to find range? Formula
To find range, subtract the least value from the highest value from a given set of numbers.
Formula:
Range = Largest number on the set – smallest number on the set
Let’s practice with this problem:
Here’s a given set: 23, 56, 32, 89, 70, 45 and 36
Identify the smallest and largest number from the set. If you cannot do it orally, try to arrange the set in ascending order and then take the highest and lowest value.
Largest number = 89
Smallest number = 23
Range = 89 – 23 = 66
Mid Range
Mid range is the number between the lowest and highest value of a given set of numbers. Just add the two numbers and take their average or divide by two.
Formula to mid range:
\frac{{Largest\text{ }value\text{ }+\text{ }Smallest\text{ }Value}}{2}So, the mid range of 23, 56, 32, 89, 70, 45 and 36 is:
\frac{{89\text{ }+\text{ }23~~~}}{2}=\frac{{112}}{2}=56So, range and mid range of {23, 56, 32, 89, 70, 45, 36} is 66 and 56 respectively.
Let’s take a couple of more examples:
Example 1
| Marks of students in class A
30, 40, 30, 45, 35, 43, 23, 44 |
|
| Range : | 45 – 23 = 22 |
| Mid Range: | (45 +23) / 2 = 68 / 2 = 34 |
Example 2
| Marks of students in class B
30, 40, 45, 40, 30, 40, 35, 40 |
|
| Range : | 45 – 30 = 15 |
| Mid Range: | (45 +30) / 2 = 75 / 2 = 37.5 |
Observation:
- As we can see that range of class B is smaller than class A, this means marks distribution in class B is more clustered (more close) in class B than class A.
- Also, range is ineffective even if the middle values are changed but the largest and smallest remain the same. So, if your middle values are varying largely it’s better to opt other methods such as mean, median and mode.
Why do we use Range? Applications
Range offers a brilliant way to understand the spread of a given data set. It is very easy to calculate as it involves basic arithmetic operations. The range is also used in other mathematical formulas of statistics such as standard deviation.
Another application of Range can be seen in whiskers plot or boxplot. The highest and lowest values of a given set a plotted at the end of on a whiskers graph. Now, the total length of box and whiskers is equal to the range.
Read More – Mathematics Questions
View More – Useful links for Your Child’s Development

Unleash the Power of visualization to break tough concepts
Wanna be the next Maths wizard? Discover the new way of learning concepts with real-life Visualization techniques and instant doubt resolutions.
Categories
Recent Posts
- List of the qualities you should look for in your tutors?
- What is the most useful formulas in math?
- Describe the process of eating to defecation of food?
- Difference between the natural and artificial active response by the immunology system.
- Explain the different circle theorems
- How are nerve cells adapted to their function?


